
Norfolk Permit Pulse: how long a permit takes
Version 1.0.0 · First published 2026-10-12 · Last updated 2026-10-14 · Data covering 2020-01-01 to 2026-10-12 · Reviewed by Ben Davis, BidBro
In short
Most Norfolk residential permits are issued within days: across 50,384 residential permits applied for between 2020-01-01 and 2026-10-12, the median wait from application to issue was 2 days. The wait is concentrated in the permits the city classes as Building work: median 20 days across 10,597 residential building permits, and one in ten took 147 days or longer. A renovation permit ran a median of 17 days (3,924 permits); a home addition 55 days (760).
These figures are arithmetic on records the City of Norfolk publishes itself. BidBro counted them and computed the medians and percentiles; the city collected them. Where this page states something the city does not, it is marked as BidBro’s interpretation. There are no forecasts and no explanations of why a number moved — see limitations. The same method, applied to the neighbouring city’s record, is the Virginia Beach Permit Pulse; the two records are typed differently, and the method section says how.
Download CSVDownload JSONCharts for republication
Residential permit review time by permit type
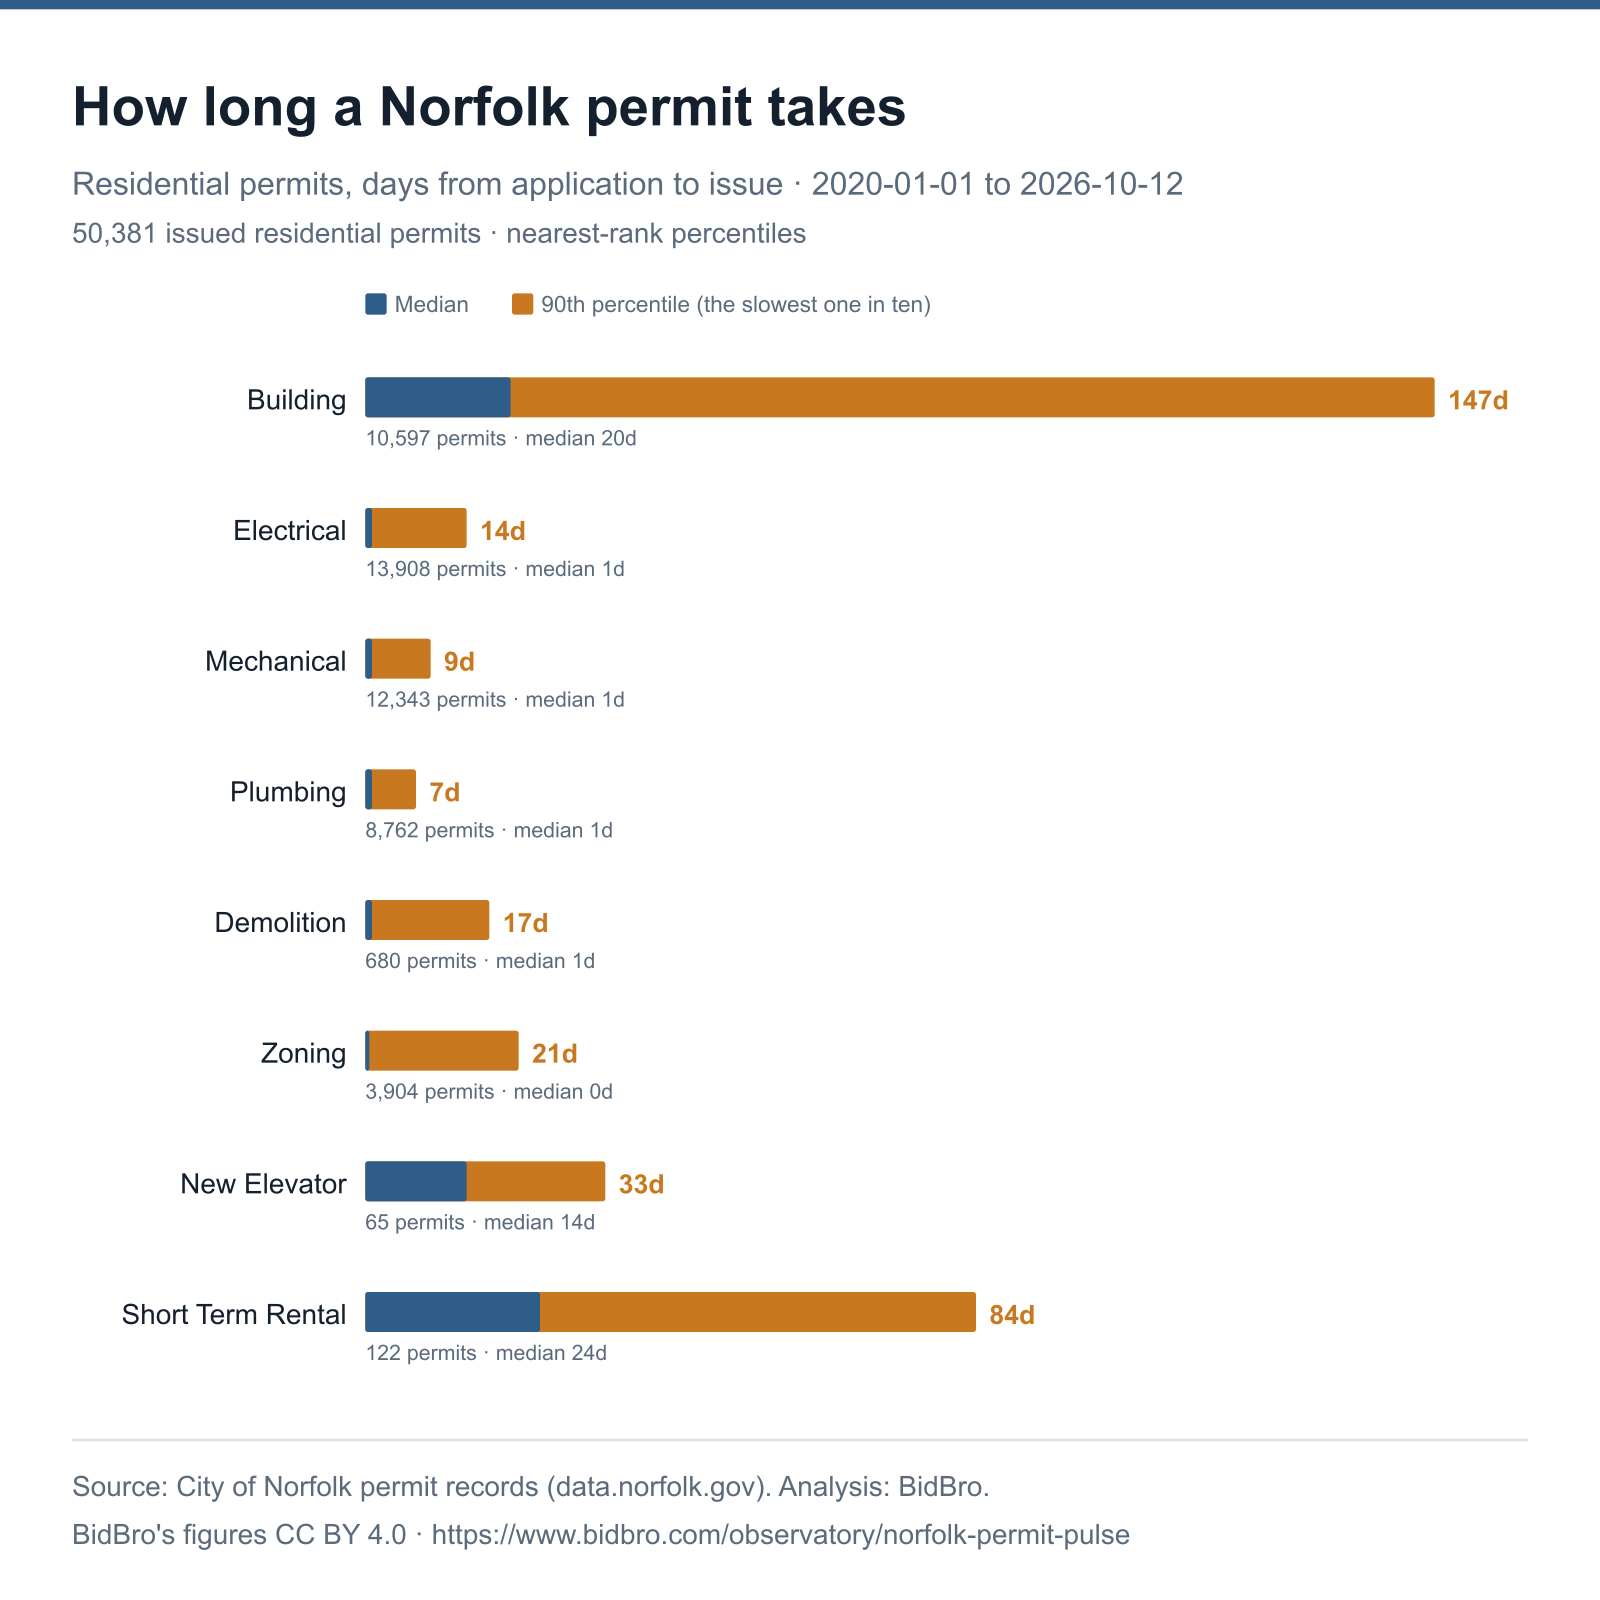
Every residential permit the city issued in the window, grouped by the permit type the city assigned. Trade permits — electrical, mechanical, plumbing — are issued almost at once (a 90th percentile of 14 days for electrical work); the review time sits in Building permits, which cover renovations, additions, re-roofs and new homes.
| Permit type (city’s label) | Permits | Median days | 25th pct | 75th pct | 90th pct |
|---|---|---|---|---|---|
| Building | 10,597 | 20 | 7 | 58 | 147 |
| Electrical | 13,908 | 1 | 0 | 4 | 14 |
| Mechanical | 12,343 | 1 | 0 | 4 | 9 |
| Plumbing | 8,762 | 1 | 0 | 3 | 7 |
| Demolition | 680 | 1 | 0 | 5 | 17 |
| Zoning | 3,904 | 0 | 0 | 5 | 21 |
| Fire Protection | 1 | — | — | — | — |
| New Elevator | 65 | 14 | 8 | 20 | 33 |
| Short Term Rental | 122 | 24 | 8 | 51 | 84 |
| Sign | 2 | — | — | — | — |
Residential building permits by the work recorded
Norfolk records a work type on each Building permit, so the slow class above can be read by project. A re-roof or rooftop solar permit took a median of 8 days (3,214 permits); a home addition 55 days, with one in ten taking 248 days or longer. The city’s label is printed first; the plain-English reading beside it is BidBro’s.
| Work type (city’s label) | Reads as | Permits | Median days | 25th pct | 75th pct | 90th pct |
|---|---|---|---|---|---|---|
| Alteration/Repair - Renovate Existing Square Footage | renovation of existing space | 3,924 | 17 | 8 | 39 | 101 |
| Addition - Increase Square Footage/Interior Expansion | home addition | 760 | 55 | 29 | 115 | 248 |
| Minor Addition | minor addition (porch, deck, small room) | 214 | 37 | 20 | 70 | 140 |
| Reroof/Solar Panels | re-roof or rooftop solar | 3,214 | 8 | 3 | 19 | 84 |
| New | new building | 2,190 | 52 | 24 | 116 | 263 |
| Replacement | replacement | 176 | 25 | 15 | 57 | 131 |
| COE | certificate of occupancy | 117 | 39 | 20 | 77 | 126 |
| Demolition | demolition | 1 | — | — | — | — |
| Homestay | — | 1 | — | — | — | — |
Residential and commercial, all permit types
Every use class the city labels. Commercial permits ran a median of 4 days across 17,123 permits, against 2 for residential. 2,330 issued permits carry no use class and appear in neither row.
| Use class | Permits | Median days | 25th pct | 75th pct | 90th pct |
|---|---|---|---|---|---|
| Commercial | 17,123 | 4 | 0 | 20 | 62 |
| Residential | 50,384 | 2 | 0 | 8 | 42 |
By application year
Residential and commercial permits by the year the application was filed. The most recent year is incomplete: permits filed late in it and not yet issued are absent, which reads as a shorter wait than the full year will show.
| Year | Residential | Commercial | ||||||||
|---|---|---|---|---|---|---|---|---|---|---|
| Permits | Median days | 25th pct | 75th pct | 90th pct | Permits | Median days | 25th pct | 75th pct | 90th pct | |
| 2020 | 7,523 | 1 | 0 | 7 | 41 | 2,192 | 3 | 0 | 19 | 102 |
| 2021 | 7,638 | 3 | 1 | 11 | 76 | 2,298 | 4 | 1 | 20 | 73 |
| 2022 | 7,798 | 2 | 0 | 12 | 73 | 1,988 | 6 | 1 | 30 | 151 |
| 2023 | 6,902 | 2 | 0 | 9 | 47 | 2,358 | 4 | 0 | 21 | 74 |
| 2024 | 6,751 | 1 | 0 | 8 | 32 | 2,421 | 4 | 0 | 20 | 50 |
| 2025 | 7,311 | 2 | 0 | 9 | 35 | 3,288 | 3 | 0 | 20 | 52 |
| 2026 | 6,461 | 1 | 0 | 5 | 18 | 2,578 | 2 | 0 | 12 | 34 |
Residential permits by month, last 24 months
Monthly volume and review time for residential permits by the month the application was filed. A month is marked provisional until the city’s records run 30 days past its end; 22 of the 24 months shown are settled. The “still open” column counts applications filed that month whose status on 2026-10-12 was still undecided (pending, in review, or awaiting information from the applicant); if the city later issues any of them, that month’s figures move.
| Month filed | Permits | Median days | 25th pct | 75th pct | 90th pct | Still open | Status |
|---|---|---|---|---|---|---|---|
| Nov 2024 | 595 | 2 | 0 | 9 | 46 | 27 | settled |
| Dec 2024 | 537 | 1 | 0 | 6 | 29 | 30 | settled |
| Jan 2025 | 603 | 2 | 0 | 7 | 34 | 42 | settled |
| Feb 2025 | 559 | 2 | 0 | 12 | 29 | 47 | settled |
| Mar 2025 | 748 | 1 | 0 | 9 | 38 | 67 | settled |
| Apr 2025 | 642 | 1 | 0 | 9 | 44 | 57 | settled |
| May 2025 | 599 | 2 | 0 | 11 | 35 | 60 | settled |
| Jun 2025 | 602 | 2 | 0 | 12 | 41 | 48 | settled |
| Jul 2025 | 664 | 2 | 0 | 12 | 35 | 57 | settled |
| Aug 2025 | 644 | 1 | 0 | 7 | 32 | 50 | settled |
| Sep 2025 | 554 | 1 | 0 | 7 | 36 | 51 | settled |
| Oct 2025 | 649 | 1 | 0 | 7 | 38 | 65 | settled |
| Nov 2025 | 487 | 2 | 0 | 8 | 30 | 38 | settled |
| Dec 2025 | 560 | 1 | 0 | 8 | 28 | 40 | settled |
| Jan 2026 | 684 | 2 | 0 | 7 | 33 | 61 | settled |
| Feb 2026 | 751 | 1 | 0 | 5 | 14 | 66 | settled |
| Mar 2026 | 840 | 1 | 0 | 5 | 20 | 91 | settled |
| Apr 2026 | 778 | 1 | 0 | 7 | 20 | 49 | settled |
| May 2026 | 645 | 1 | 0 | 6 | 22 | 86 | settled |
| Jun 2026 | 748 | 1 | 0 | 6 | 25 | 95 | settled |
| Jul 2026 | 710 | 1 | 0 | 5 | 18 | 79 | settled |
| Aug 2026 | 595 | 1 | 0 | 4 | 14 | 88 | settled |
| Sep 2026 | 574 | 1 | 0 | 3 | 8 | 127 | provisional |
| Oct 2026 | 136 | 1 | 0 | 1 | 3 | 98 | provisional |
Charts, free to republish
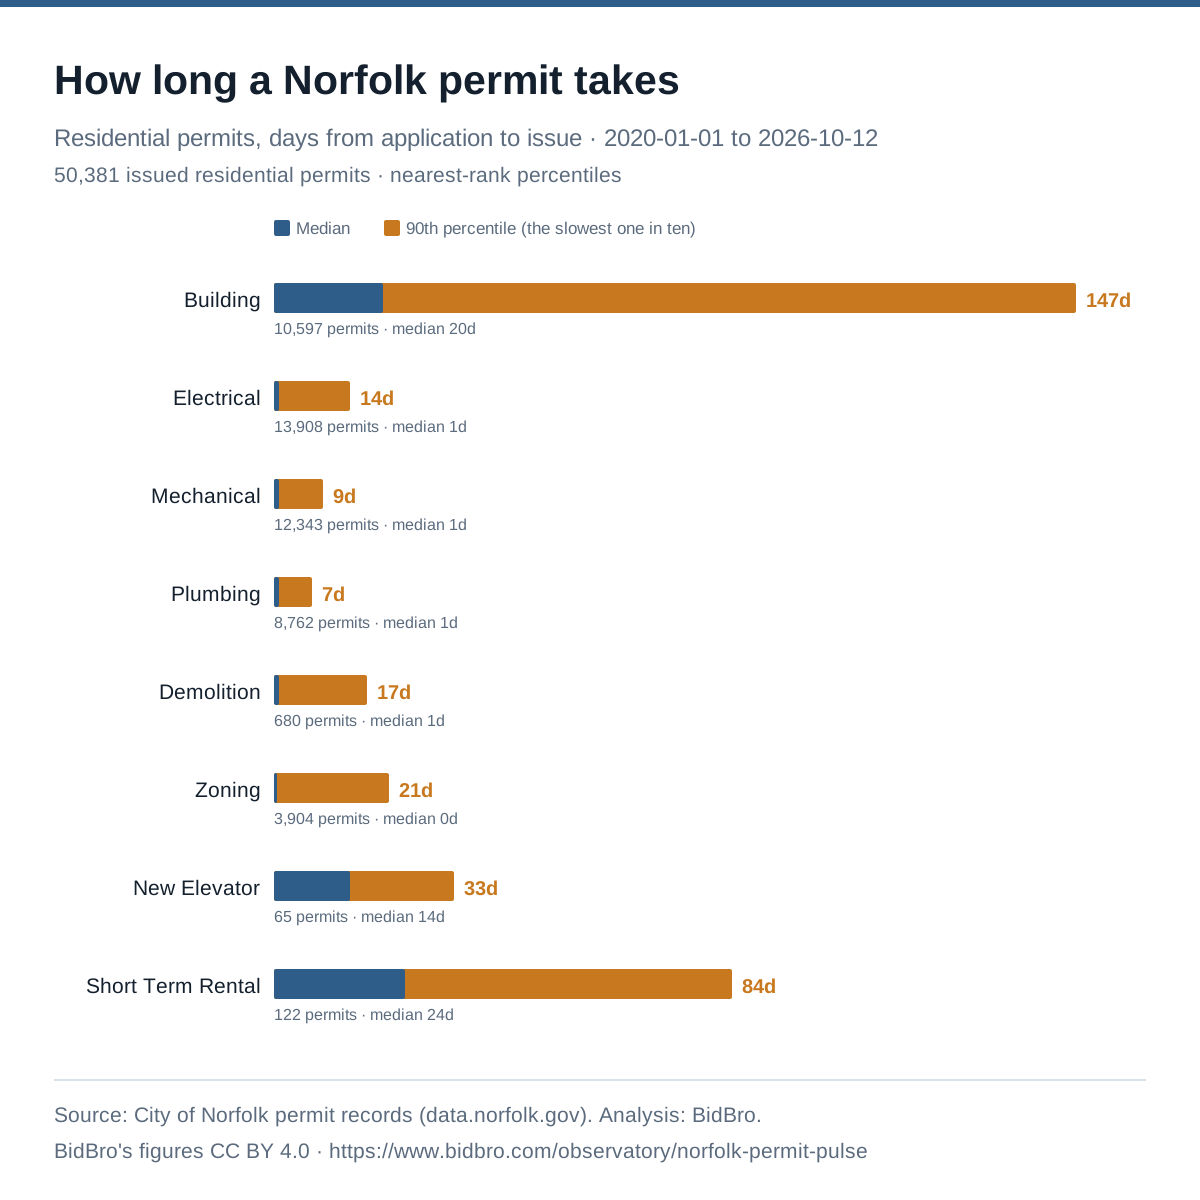
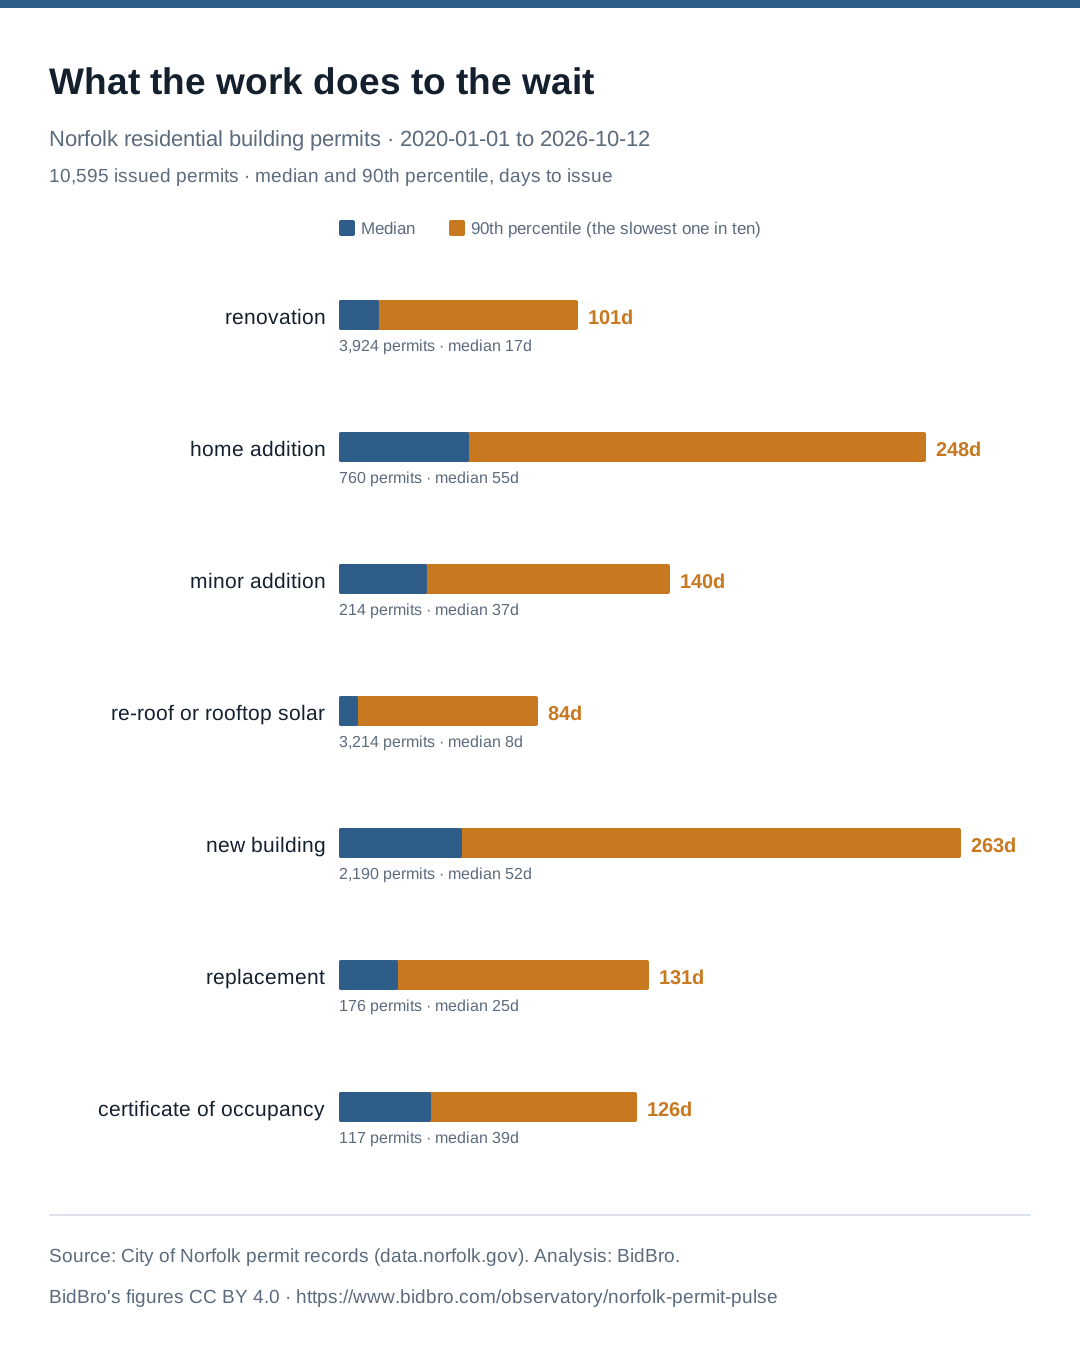
Two charts drawn from the permit-type and work-type tables above. Each is a PNG and an SVG, each carries its source and licence inside the artwork, and each is followed by the same numbers written out, so a figure can be checked without opening an image.
Why there is no chart over time. A permit enters these figures only once the city issues it, and Norfolk’s record keeps undecided applications open for years. On 2026-10-12, 2,663 residential applications were still undecided, and in the monthly table the months nearest that date hold the most of them, so a line over time would fall whether or not permits got faster. The by-year and by-month tables keep those figures with their “still open” counts beside them.
Attribution, precisely. BidBro’s figures are CC BY 4.0. Credit “BidBro, from City of Norfolk permit records”. The city’s dataset page states no licence for its records, which are credited as its page asks. A link back is welcome and is never required.
PNG (1200×1200, 142 kB)SVG (vector)
Text equivalent — the numbers in this chart
| Series | Median days | 90th percentile days | Permits |
|---|---|---|---|
| Building | 20 | 147 | 10,597 |
| Electrical | 1 | 14 | 13,908 |
| Mechanical | 1 | 9 | 12,343 |
| Plumbing | 1 | 7 | 8,762 |
| Demolition | 1 | 17 | 680 |
| Zoning | 0 | 21 | 3,904 |
| New Elevator | 14 | 33 | 65 |
| Short Term Rental | 24 | 84 | 122 |
Embed code
<figure>
  <img src="https://www.bidbro.com/data/observatory/charts/norfolk-permit-review-time-by-type.png"
       alt="Horizontal bar chart of Norfolk residential permit review times by permit type. Building: median 20 days, 90th percentile 147 days, 10,597 permits. Electrical: median 1 days, 90th percentile 14 days, 13,908 permits. Mechanical: median 1 days, 90th percentile 9 days, 12,343 permits. Plumbing: median 1 days, 90th percentile 7 days, 8,762 permits. Demolition: median 1 days, 90th percentile 17 days, 680 permits. Zoning: median 0 days, 90th percentile 21 days, 3,904 permits. New Elevator: median 14 days, 90th percentile 33 days, 65 permits. Short Term Rental: median 24 days, 90th percentile 84 days, 122 permits."
       width="1200" height="1200" style="max-width:100%;height:auto">
  <figcaption>
    Chart: BidBro. Source: City of Norfolk permit records.
    <a href="https://www.bidbro.com/observatory/norfolk-permit-pulse">Norfolk Permit Pulse</a> · CC BY 4.0 (BidBro's figures)
  </figcaption>
</figure>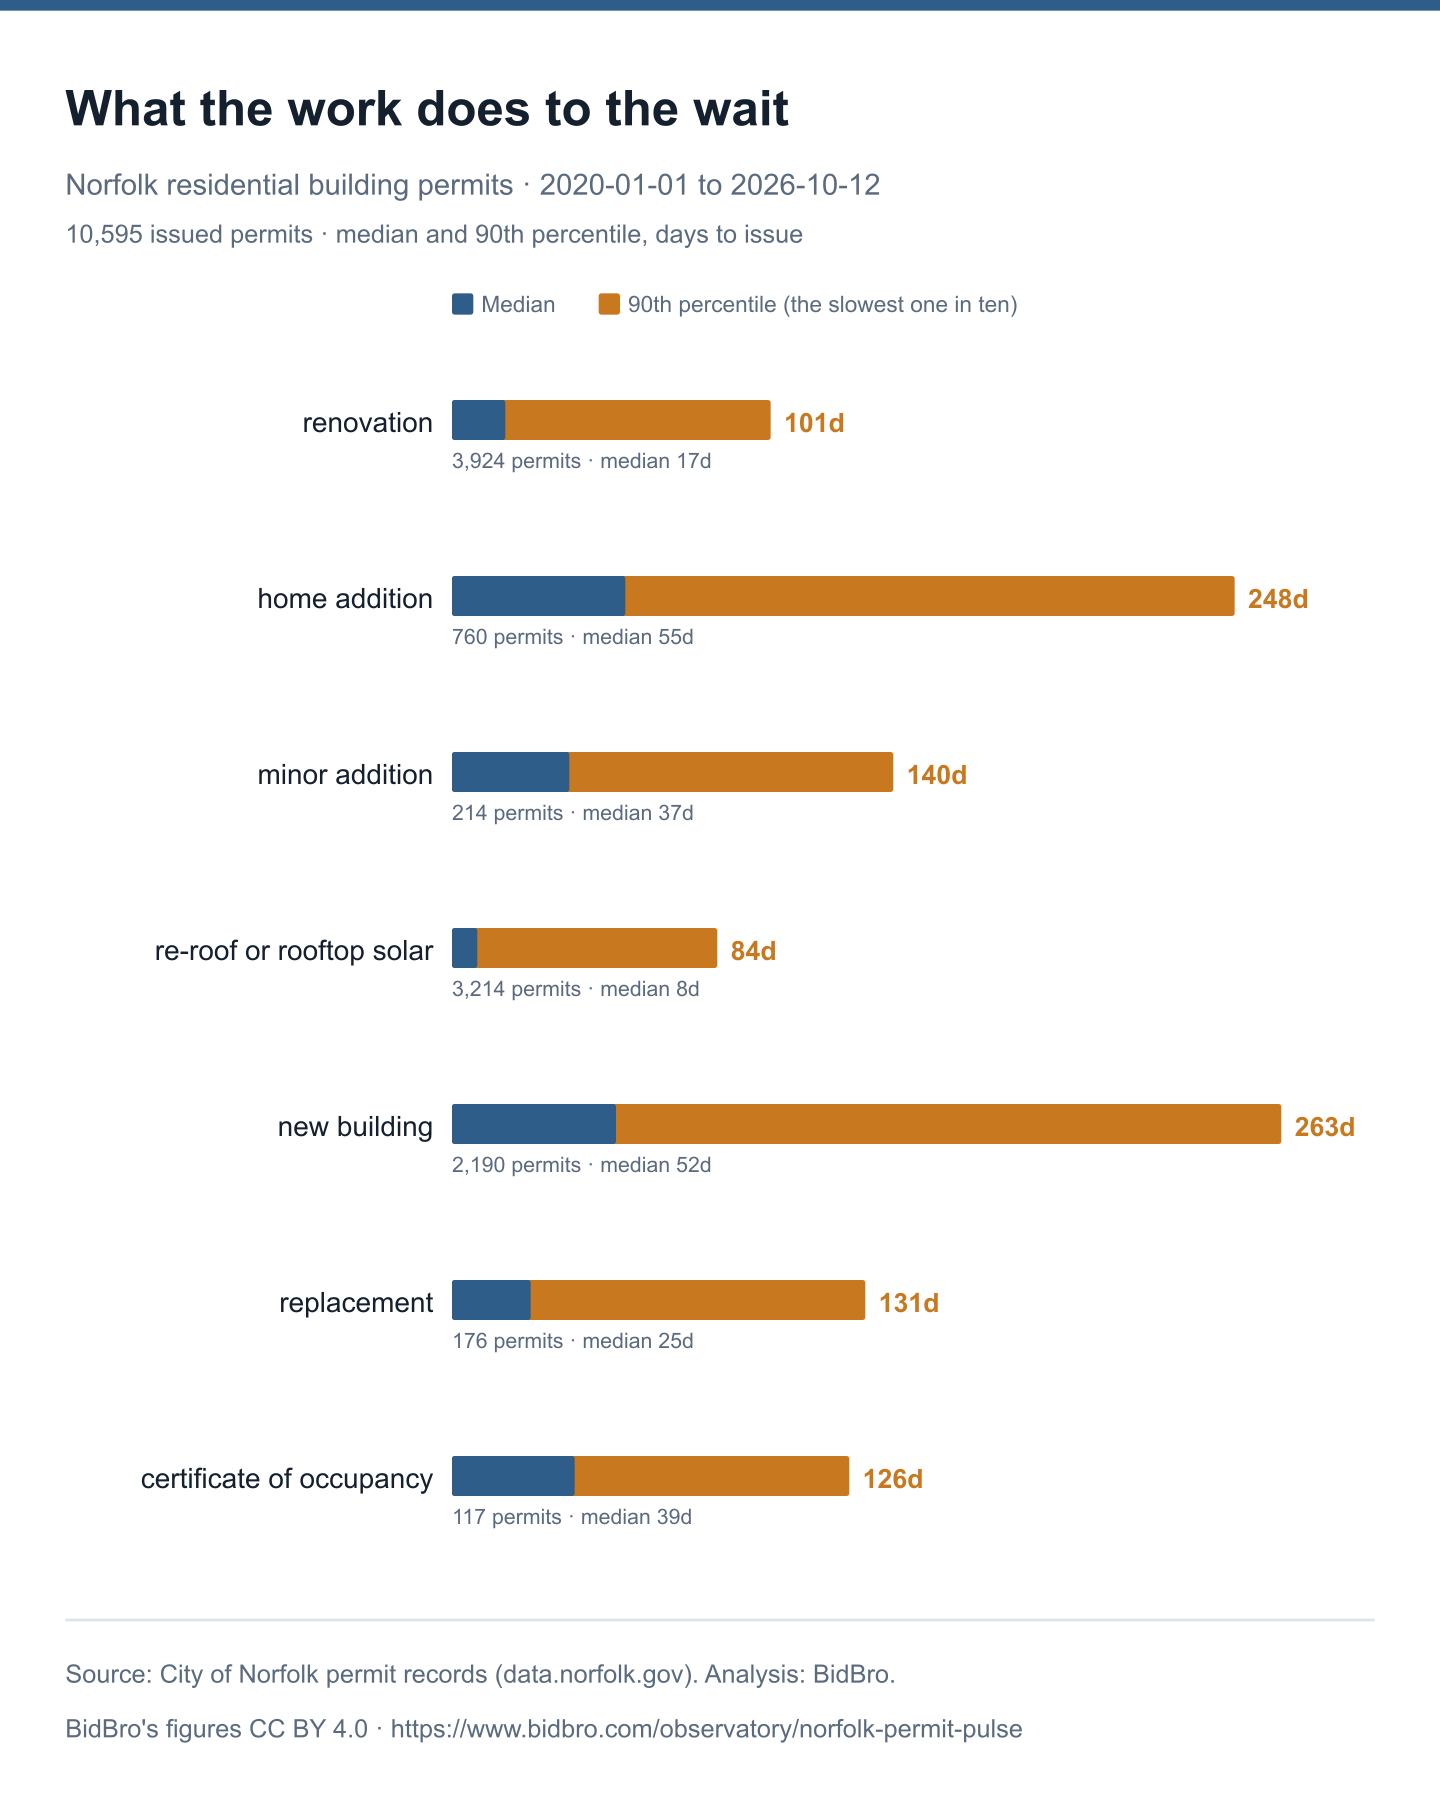
PNG (1080×1350, 136 kB)SVG (vector)
Text equivalent — the numbers in this chart
| Series | Median days | 90th percentile days | Permits |
|---|---|---|---|
| renovation of existing space | 17 | 101 | 3,924 |
| home addition | 55 | 248 | 760 |
| minor addition (porch, deck, small room) | 37 | 140 | 214 |
| re-roof or rooftop solar | 8 | 84 | 3,214 |
| new building | 52 | 263 | 2,190 |
| replacement | 25 | 131 | 176 |
| certificate of occupancy | 39 | 126 | 117 |
Embed code
<figure>
  <img src="https://www.bidbro.com/data/observatory/charts/norfolk-permit-review-time-by-work.png"
       alt="Horizontal bar chart of Norfolk residential building permit review times by the work recorded. renovation of existing space: median 17 days, 90th percentile 101 days, 3,924 permits. home addition: median 55 days, 90th percentile 248 days, 760 permits. minor addition (porch, deck, small room): median 37 days, 90th percentile 140 days, 214 permits. re-roof or rooftop solar: median 8 days, 90th percentile 84 days, 3,214 permits. new building: median 52 days, 90th percentile 263 days, 2,190 permits. replacement: median 25 days, 90th percentile 131 days, 176 permits. certificate of occupancy: median 39 days, 90th percentile 126 days, 117 permits."
       width="1080" height="1350" style="max-width:100%;height:auto">
  <figcaption>
    Chart: BidBro. Source: City of Norfolk permit records.
    <a href="https://www.bidbro.com/observatory/norfolk-permit-pulse">Norfolk Permit Pulse</a> · CC BY 4.0 (BidBro's figures)
  </figcaption>
</figure>
How these numbers were produced
- Source
- The City of Norfolk’s “Permits” dataset, published by the City of Norfolk — Department of City Planning, Development Services Center (DSC) through the city open data portal and updated daily on weekdays, per the dataset description. The city describes it as: “This dataset offers a listing of permits issued by Norfolk City Planning’s Development Service Center (DSC). It encompasses a wide range of permit types, including those for building, plumbing, electrical, mechanical, fire safety, amusement, elevators, certificates of occupancy, zoning, and others.” Extracted 2026-10-12 through the portal’s JSON endpoint.
- Unit of observation
- one permit record published by the City of Norfolk on its open data portal.
- What is measured
- calendar days from the application date the city recorded to the issue date the city recorded. This is permit review time — not how long the construction work takes, and not the time from a homeowner’s first call to a finished project.
- Population and window
- The city’s register held 87,185 permit records with an application date on or after 2020-01-01 at extraction, the latest filed 2026-10-12. All of them were retrieved and counted; none were sampled. 69,837 had both an application date and an issue date and enter the statistics — 50,384 classed residential, 17,123 commercial. The window starts at 2020 so that this release and the Norfolk cost guides describe one population.
- How the city’s fields are used
- Norfolk types each permit by
type(Building, Electrical, Mechanical, Plumbing, Demolition, Zoning and others) and byuse_class(Residential or Commercial), and records awork_typeon Building permits. The tables follow those fields as the city wrote them; BidBro adds only the plain-English reading beside each work type. Virginia Beach’s record is typed by a single construction class, which is why the two Pulses do not share every table. - Exclusions, and how large each one is
- 17,305 records had no issue date and are excluded from every duration figure. 10,381 of them are residential; of those, 2,663 were still undecided on 2026-10-12 (the “still open” column) and the rest were withdrawn, cancelled, abandoned, expired, denied or revoked before issue.
- 42 records had an issue date before their application date and were dropped as data errors rather than counted as zero.
- 1 record carried an application date after the extraction date and was dropped as a data error.
- 2,330 issued permits carry no use class and appear in no residential or commercial total. They are not redistributed.
- Percentiles
- nearest-rank, not interpolated — every published percentile is a value some permit actually took. A permit issued the same day it was applied for counts as zero days, not one.
- Suppression floor
- Any cell computed from fewer than 30 permits is withheld and shown as “—”, with its permit count still visible so a reader can see what was suppressed and why.
- What is never published
- Street address, permit number, parcel identifier, tax account and applicant are never requested from the city’s endpoint and never appear here or in the downloads. No BidBro bid record, contractor identity or homeowner information is used anywhere in this release.
- Reproducing this
- Every figure is a count, a median or a percentile over the city’s rows. Download the CSV or JSON above, or query the city’s endpoint directly for applications since 2020-01-01 and repeat the arithmetic: keep records with both dates present, subtract, and take the nearest-rank percentile within each of the city’s own labels.
Limitations
- This measures the city’s clock, not the applicant’s. A permit returned for corrections and resubmitted may appear as a new record; where it does, the wait a homeowner experienced is longer than any figure here.
- Permit review time is not project time. Nothing here describes how long work takes once a permit is in hand.
- Recent months read low until they settle. A permit enters these figures only once it is issued, so a month near the end of the city’s records holds its fast permits and not yet its slow ones. Months are marked provisional until the records run 30 days past their end.
- Undecided applications are a live population. Unlike Virginia Beach’s feed, Norfolk’s keeps applications open for years while they await information from the applicant. Every “still open” row is excluded today; any the city later issues will lengthen that month’s figures when this release is refreshed.
- Suppressed rows are still counted. Permit types with fewer than 30 residential permits (fire protection, signs) show their count and no percentile.
- No causal claims. This release does not say why any figure is what it is, and does not attribute any change to city staffing, policy, or demand.
- BidBro is an interested party. BidBro operates a contractor bidding platform in this market. That is why the method, the exclusions and the underlying file are all published: so the arithmetic can be checked by someone who does not take our word for it.
- The city’s data is the city’s. Its completeness and accuracy are outside BidBro’s control.
License, citation and corrections
BidBro’s aggregate tables, the downloadable files and the interpretation on this page are published under Creative Commons Attribution 4.0. Republish them, including commercially, with attribution. The underlying records remain the City of Norfolk’s: The dataset page states no licence (the portal metadata reads license: null, provenance OFFICIAL). BidBro reuses the records as the City of Norfolk’s public permit record, credits the Development Services Center as the dataset page asks, and asserts no licence on the city’s behalf. Reporters are welcome to use these tables directly; if a figure you need is not here, ask and we will say whether the data supports it.
Suggested citation
BidBro. “Norfolk Permit Pulse: how long a permit takes.” Hampton Roads Home Project Observatory, version 1.0.0, 2026-10-14. Derived from the City of Norfolk’s published permit register. https://www.bidbro.com/observatory/norfolk-permit-pulse
Corrections and data requests
Found an error in this arithmetic, or need a Hampton Roads construction figure for a story? Email ben.davis@bidbro.com — Ben Davis, Spokesperson, BidBro. BidBro publishes no phone number. Press questions we can support with defensible data get a human answer within one business day; where we cannot support a number, we say so rather than estimate. Full media kit: bidbro.com/press.
Version history
- 1.0.0 — 2026-10-12. First publication. 87,185 city permit records with an application date from 2020-01-01, extracted 2026-10-12 from the city’s open data portal; 69,837 issued permits in window (50,384 residential, 17,123 commercial). Tables by permit type, by the work recorded on residential building permits, by use class, by year and by month; CSV and JSON downloads. No charts yet.
- 1.0.0 — 2026-10-14. Distribution kit added: two charts in PNG and SVG (residential review time by permit type; residential building permits by the work recorded), each with its numbers as text and an embed snippet. They are drawn from the same 1.0.0 files, which is why the version number did not move. No chart over time, for the reason given beside the charts.
Corrections are added here as dated entries. A number that changes is never quietly replaced.
Elsewhere on BidBro
- Norfolk contractors — contractors by trade, with licence records where on file.
- Norfolk home project costs, from the city’s permit register — what was declared on the same residential permits, by project type.
- Home renovation cost in Norfolk and home addition cost in Norfolk — the two project types whose permit review times are read above.
- Hampton Roads permit, inspection and zoning sources — Norfolk’s official permit-office pages, re-checked weekly.
- Virginia Beach Permit Pulse — the same measure for the neighbouring city.
- Virginia contractors — the statewide directory this market sits inside.
- Virginia home-improvement projects — project listings by city.
- Hampton Roads Home Project Observatory — the methodology and standing rules every release follows.