
Virginia Beach Permit Pulse: how long a building permit takes
Version 1.2.0 · First published 2026-08-04 · Last updated 2026-09-27 · Data covering 2023-01-01 to 2026-09-11 · Reviewed by Ben Davis, BidBro
In short
Most Virginia Beach residential building permits are issued almost immediately: across 61,407 residential permits applied for between 2023-01-01 and 2026-09-11, the median wait from application to issue was 1 day. The delay sits in the tail, not the middle. One residential permit in ten took 12 days or longer, and for permits the city classes as Building work that figure is 26 days.
These figures are arithmetic on records the City of Virginia Beach publishes itself. BidBro counted them and computed the medians and percentiles; the city collected them. Where this page states something the city does not, it is marked as BidBro’s interpretation. There are no forecasts and no explanations of why a number moved — see limitations.
Download CSVDownload JSONCharts for republication
Residential permit review time by trade
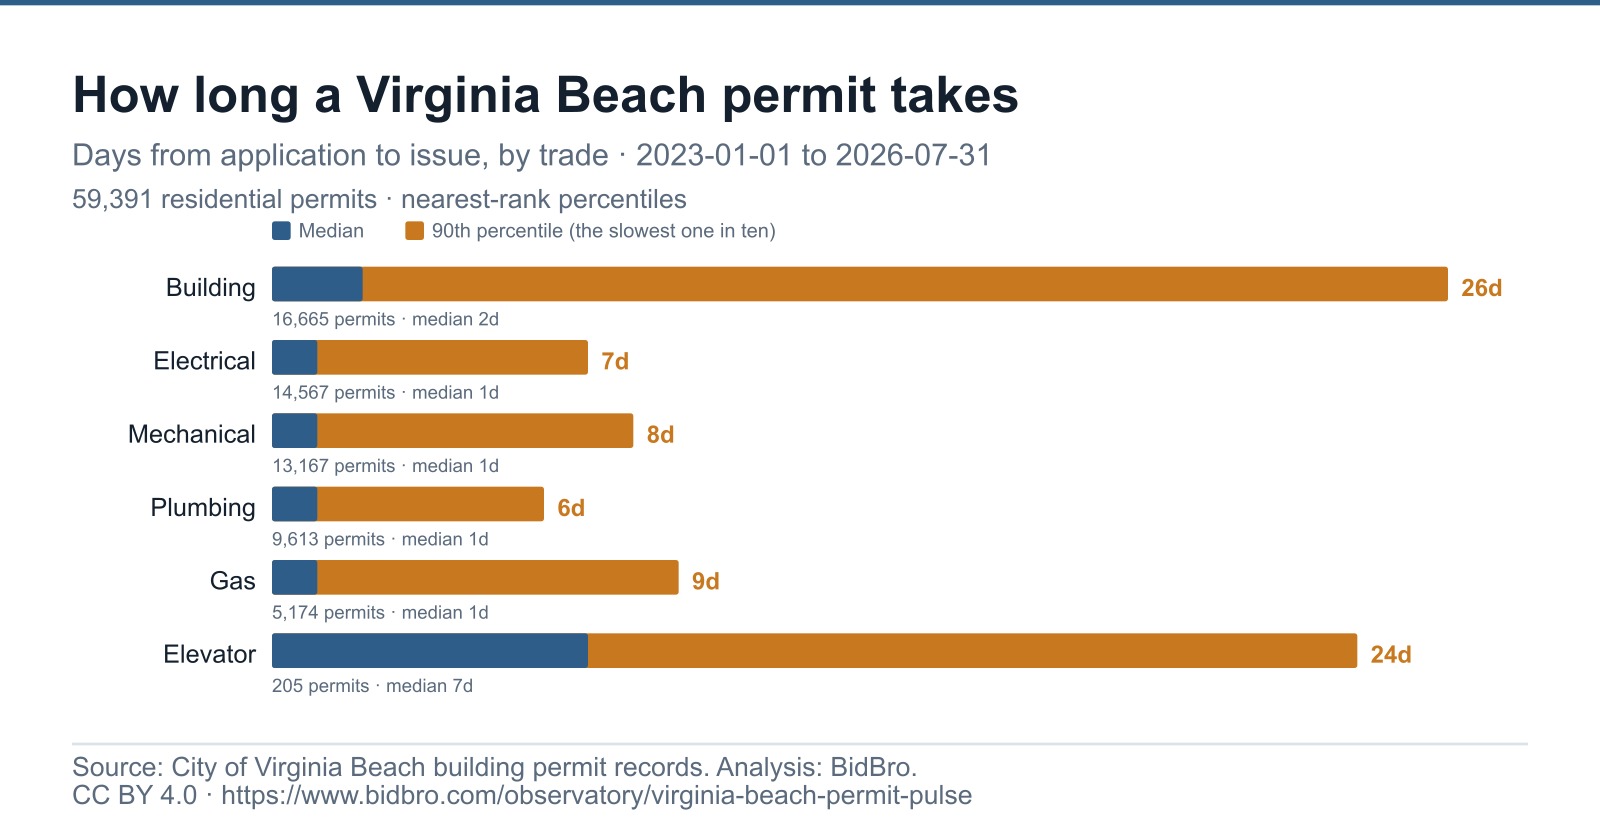
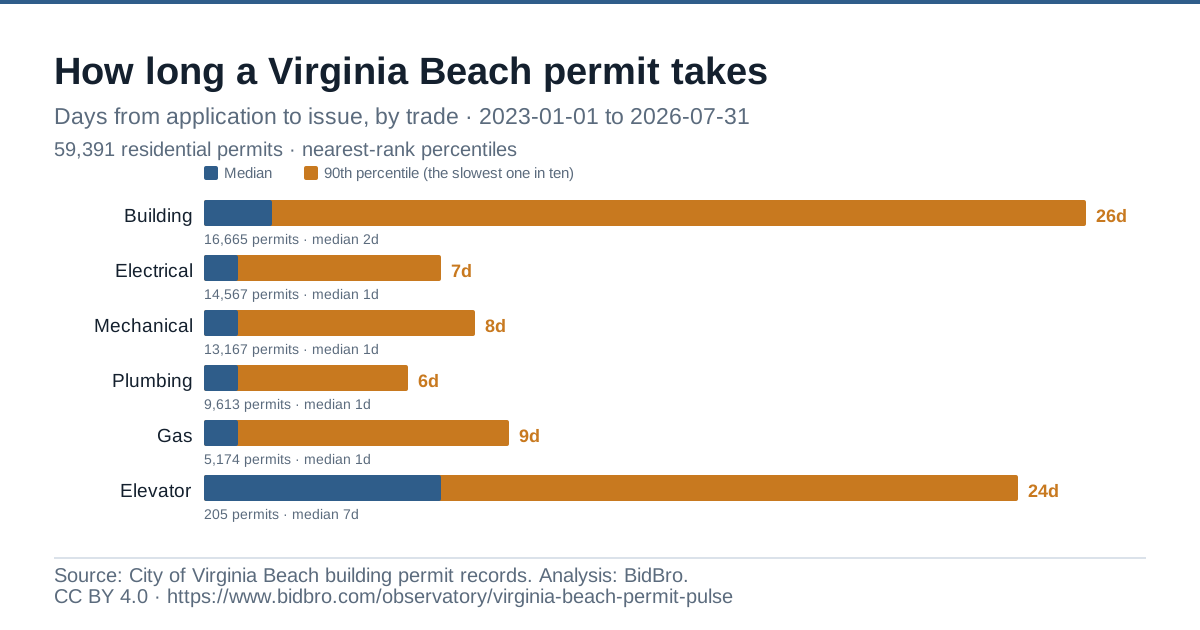
Every residential permit the city issued in the window, grouped by the permit type the city assigned. A 90th-percentile figure of 7 days for electrical work against 26 days for Building work is the practical difference between scheduling a subcontractor and scheduling a project.
| Permit type | Permits | Median days | 25th pct | 75th pct | 90th pct |
|---|---|---|---|---|---|
| Building | 17,263 | 2 | 0 | 10 | 26 |
| Electrical | 15,035 | 1 | 0 | 3 | 7 |
| Mechanical | 13,632 | 1 | 0 | 4 | 8 |
| Plumbing | 9,954 | 1 | 0 | 2 | 6 |
| Gas | 5,312 | 1 | 0 | 3 | 8 |
| Elevator | 211 | 8 | 4 | 15 | 26 |
Review time by construction class
The city labels each permit with a construction class. Roof and siding work is tracked separately from general residential work, and it waits longer: 3 days at the median against 1 for residential overall, on 1,236 permits.
| Construction class | Permits | Median days | 25th pct | 75th pct | 90th pct |
|---|---|---|---|---|---|
| Asbestos | 57 | 6 | 1 | 21 | 42 |
| Commercial | 18,372 | 1 | 0 | 9 | 33 |
| Construction | 1,153 | 0 | 0 | 0 | 0 |
| Residential | 61,407 | 1 | 0 | 4 | 12 |
| Roof and or Siding | 1,236 | 3 | 1 | 7 | 14 |
Year by year: residential and commercial
Grouped by the year the application was filed. 2026 is a partial year — it covers applications through 2026-09-11 only, and is not comparable to a full year on volume.
| Application year | Residential | Commercial | ||||
|---|---|---|---|---|---|---|
| Permits | Median days | 90th pct | Permits | Median days | 90th pct | |
| 2023 | 16,220 | 1 | 11 | 5,225 | 1 | 30 |
| 2024 | 16,040 | 1 | 13 | 4,714 | 1 | 41 |
| 2025 | 16,695 | 1 | 13 | 4,837 | 1 | 37 |
| 2026 (partial) | 12,452 | 1 | 11 | 3,596 | 1 | 26 |
Monthly residential volume and wait, last 24 months
| Month applied | Permits issued | Median days | 75th pct | 90th pct | Still awaiting decision |
|---|---|---|---|---|---|
| Oct 2024 | 1,404 | 1 | 4 | 11 | 0 |
| Nov 2024 | 1,291 | 1 | 4 | 14 | 0 |
| Dec 2024 | 1,139 | 1 | 5 | 14 | 0 |
| Jan 2025 | 1,314 | 1 | 4 | 14 | 1 |
| Feb 2025 | 1,148 | 1 | 5 | 14 | 0 |
| Mar 2025 | 1,411 | 1 | 5 | 15 | 0 |
| Apr 2025 | 1,601 | 1 | 5 | 14 | 0 |
| May 2025 | 1,361 | 1 | 7 | 14 | 0 |
| Jun 2025 | 1,324 | 1 | 3 | 10 | 0 |
| Jul 2025 | 1,584 | 1 | 6 | 14 | 0 |
| Aug 2025 | 1,540 | 1 | 4 | 13 | 0 |
| Sep 2025 | 1,464 | 1 | 5 | 13 | 0 |
| Oct 2025 | 1,542 | 1 | 4 | 13 | 1 |
| Nov 2025 | 1,157 | 1 | 4 | 12 | 1 |
| Dec 2025 | 1,249 | 1 | 6 | 14 | 0 |
| Jan 2026 | 1,365 | 1 | 4 | 10 | 1 |
| Feb 2026 | 1,326 | 1 | 5 | 13 | 0 |
| Mar 2026 | 1,628 | 1 | 4 | 12 | 0 |
| Apr 2026 | 1,688 | 1 | 5 | 11 | 0 |
| May 2026 | 1,424 | 1 | 4 | 11 | 0 |
| Jun 2026 | 1,652 | 1 | 4 | 9 | 0 |
| Jul 2026 | 1,587 | 1 | 5 | 12 | 0 |
| Aug 2026 (provisional) | 1,363 | 1 | 3 | 8 | 0 |
| Sep 2026 (provisional) | 419 | 1 | 2 | 5 | 0 |
- Aug 2026 is provisional: the city's records run only to 2026-09-11; this month settles on 2026-09-30.
- Sep 2026 is provisional: the city's records run only to 2026-09-11; this month settles on 2026-10-30.
Charts, free to republish
Three charts drawn from the tables above, in the shapes a newsroom usually needs. Each is available as a PNG and as an SVG, each carries its source and licence inside the artwork so it stays credited if it travels without this page, and each is followed by the same numbers written out, so a figure can be checked without opening an image.
Attribution, precisely. These are CC BY 4.0. Credit “BidBro, from City of Virginia Beach building permit records”. A link back is welcome and is never required — the licence is satisfied by that plain-text credit, and nothing about using these charts is conditional on linking to BidBro.
PNG (1200×630, 107 kB)SVG (vector)
Text equivalent — the numbers in this chart
| Series | Median days | 90th percentile days | Permits |
|---|---|---|---|
| Building | 2 | 26 | 17,263 |
| Electrical | 1 | 7 | 15,035 |
| Mechanical | 1 | 8 | 13,632 |
| Plumbing | 1 | 6 | 9,954 |
| Gas | 1 | 8 | 5,312 |
| Elevator | 8 | 26 | 211 |
Embed code
<figure>
  <img src="https://www.bidbro.com/data/observatory/charts/permit-review-time-by-trade.png"
       alt="Horizontal bar chart of Virginia Beach permit review times by trade. Building: median 2 days, 90th percentile 26 days, 17,263 permits. Electrical: median 1 days, 90th percentile 7 days, 15,035 permits. Mechanical: median 1 days, 90th percentile 8 days, 13,632 permits. Plumbing: median 1 days, 90th percentile 6 days, 9,954 permits. Gas: median 1 days, 90th percentile 8 days, 5,312 permits. Elevator: median 8 days, 90th percentile 26 days, 211 permits."
       width="1200" height="630" style="max-width:100%;height:auto">
  <figcaption>
    Chart: BidBro. Source: City of Virginia Beach building permit records.
    <a href="https://www.bidbro.com/observatory/virginia-beach-permit-pulse">Virginia Beach Permit Pulse</a> · CC BY 4.0
  </figcaption>
</figure>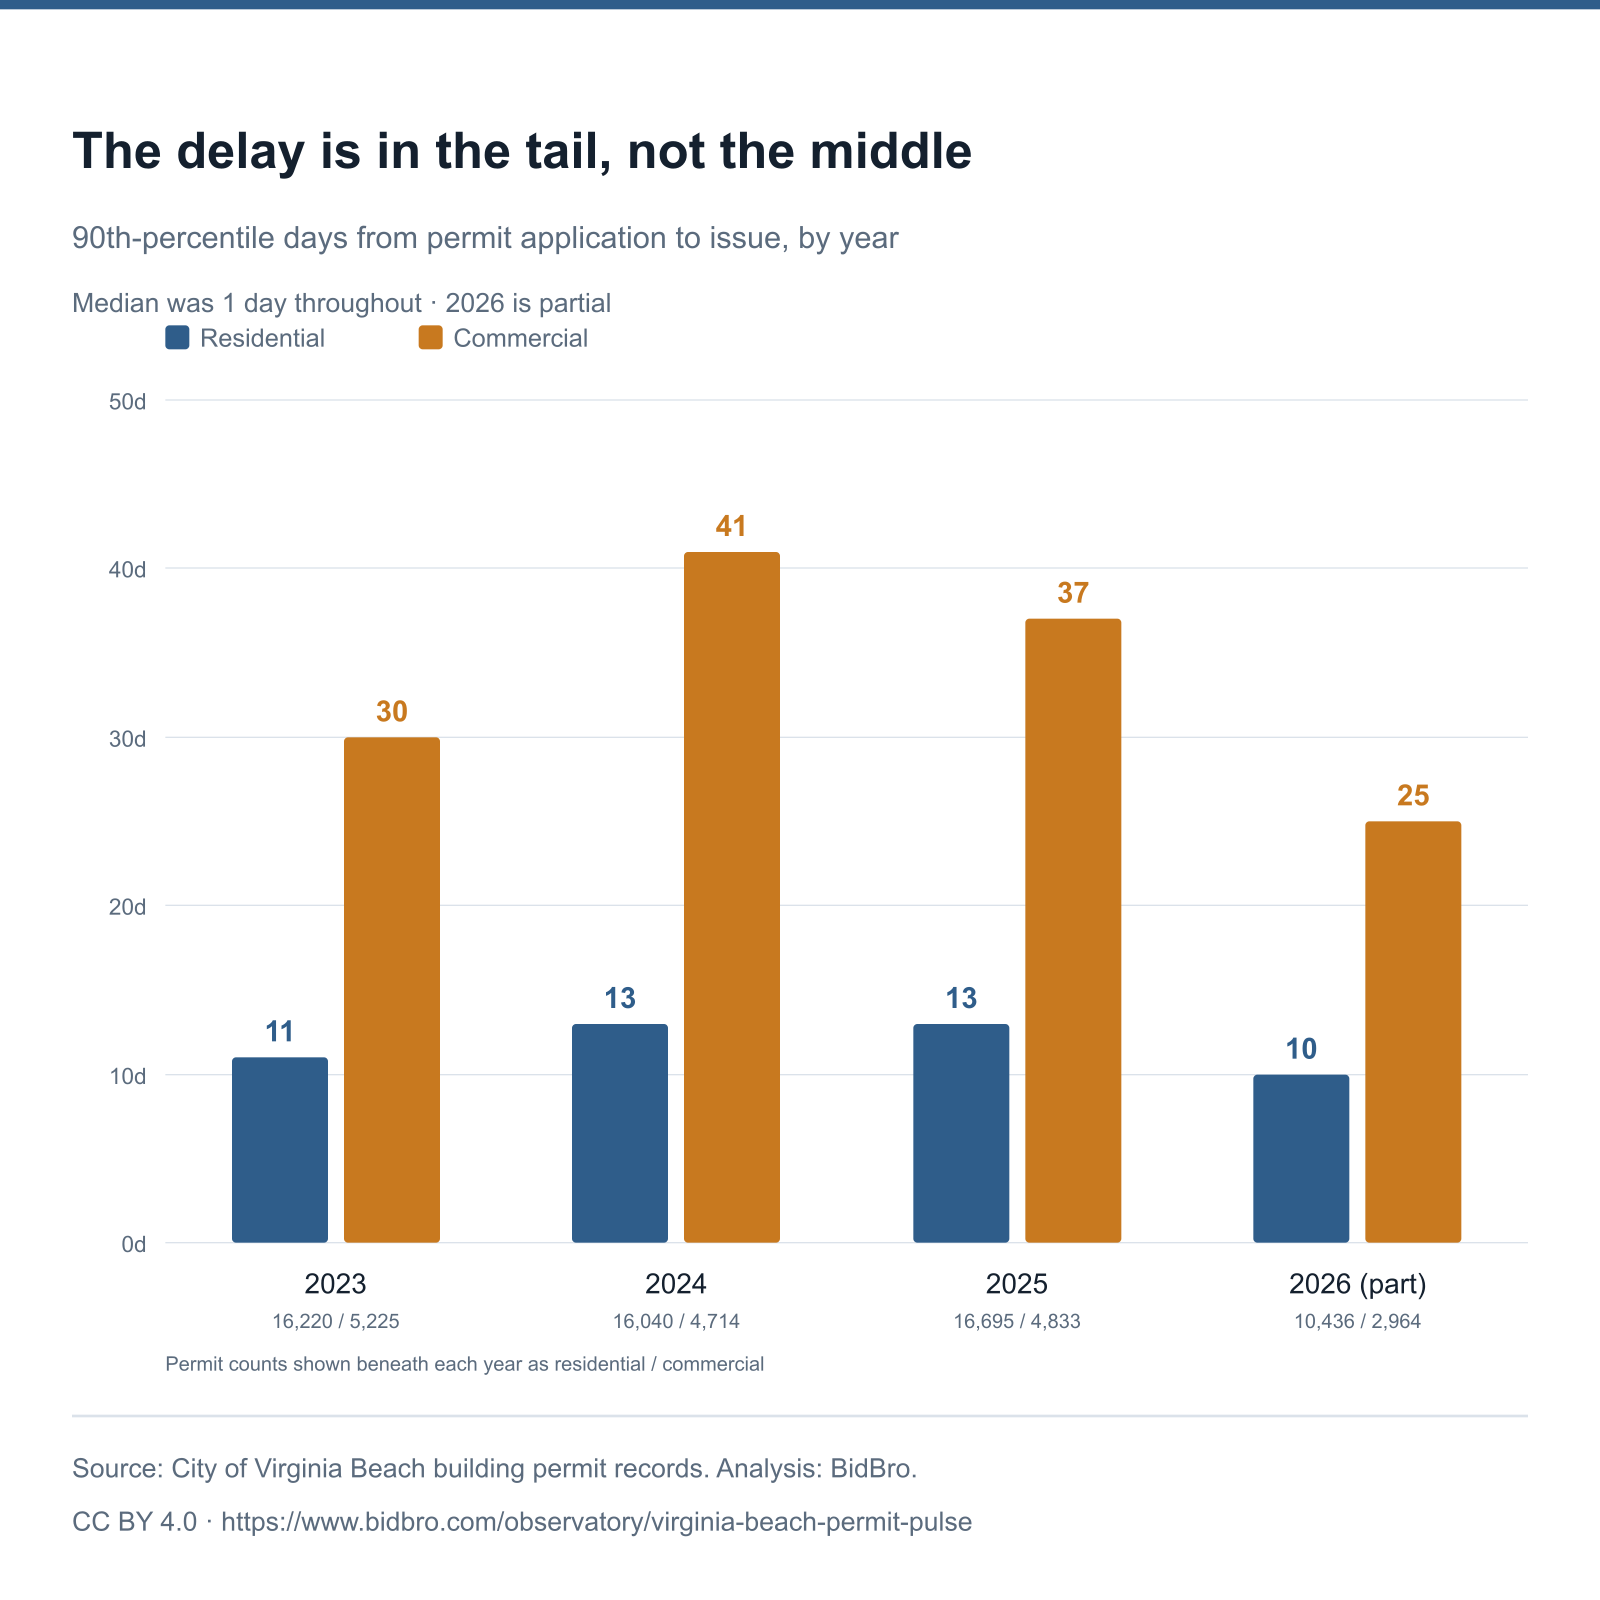
PNG (1200×1200, 115 kB)SVG (vector)
Text equivalent — the numbers in this chart
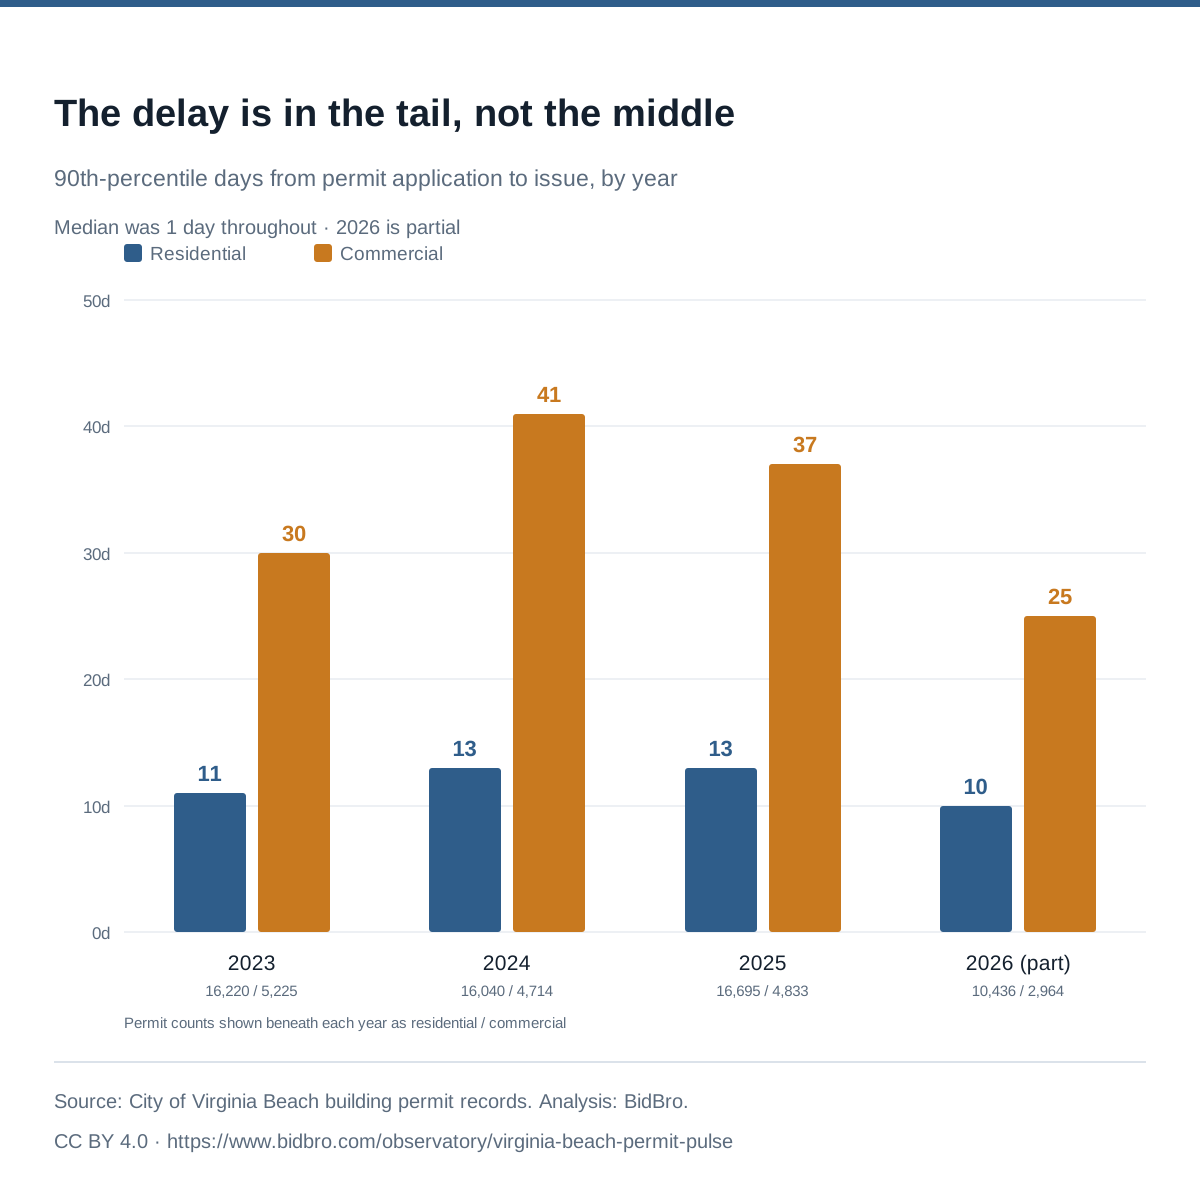
| Series | Residential 90th percentile days | Residential permits | Commercial 90th percentile days | Commercial permits | Permits |
|---|---|---|---|---|---|
| 2023 | 11 | 16,220 | 30 | 5,225 | 21,445 |
| 2024 | 13 | 16,040 | 41 | 4,714 | 20,754 |
| 2025 | 13 | 16,695 | 37 | 4,837 | 21,532 |
| 2026 (partial) | 11 | 12,452 | 26 | 3,596 | 16,048 |
Embed code
<figure>
  <img src="https://www.bidbro.com/data/observatory/charts/permit-tail-by-year.png"
       alt="Grouped bar chart of 90th-percentile Virginia Beach permit review times by year. 2023: residential 11 days across 16,220 permits, commercial 30 days across 5,225 permits. 2024: residential 13 days across 16,040 permits, commercial 41 days across 4,714 permits. 2025: residential 13 days across 16,695 permits, commercial 37 days across 4,837 permits. 2026: residential 11 days across 12,452 permits, commercial 26 days across 3,596 permits."
       width="1200" height="1200" style="max-width:100%;height:auto">
  <figcaption>
    Chart: BidBro. Source: City of Virginia Beach building permit records.
    <a href="https://www.bidbro.com/observatory/virginia-beach-permit-pulse">Virginia Beach Permit Pulse</a> · CC BY 4.0
  </figcaption>
</figure>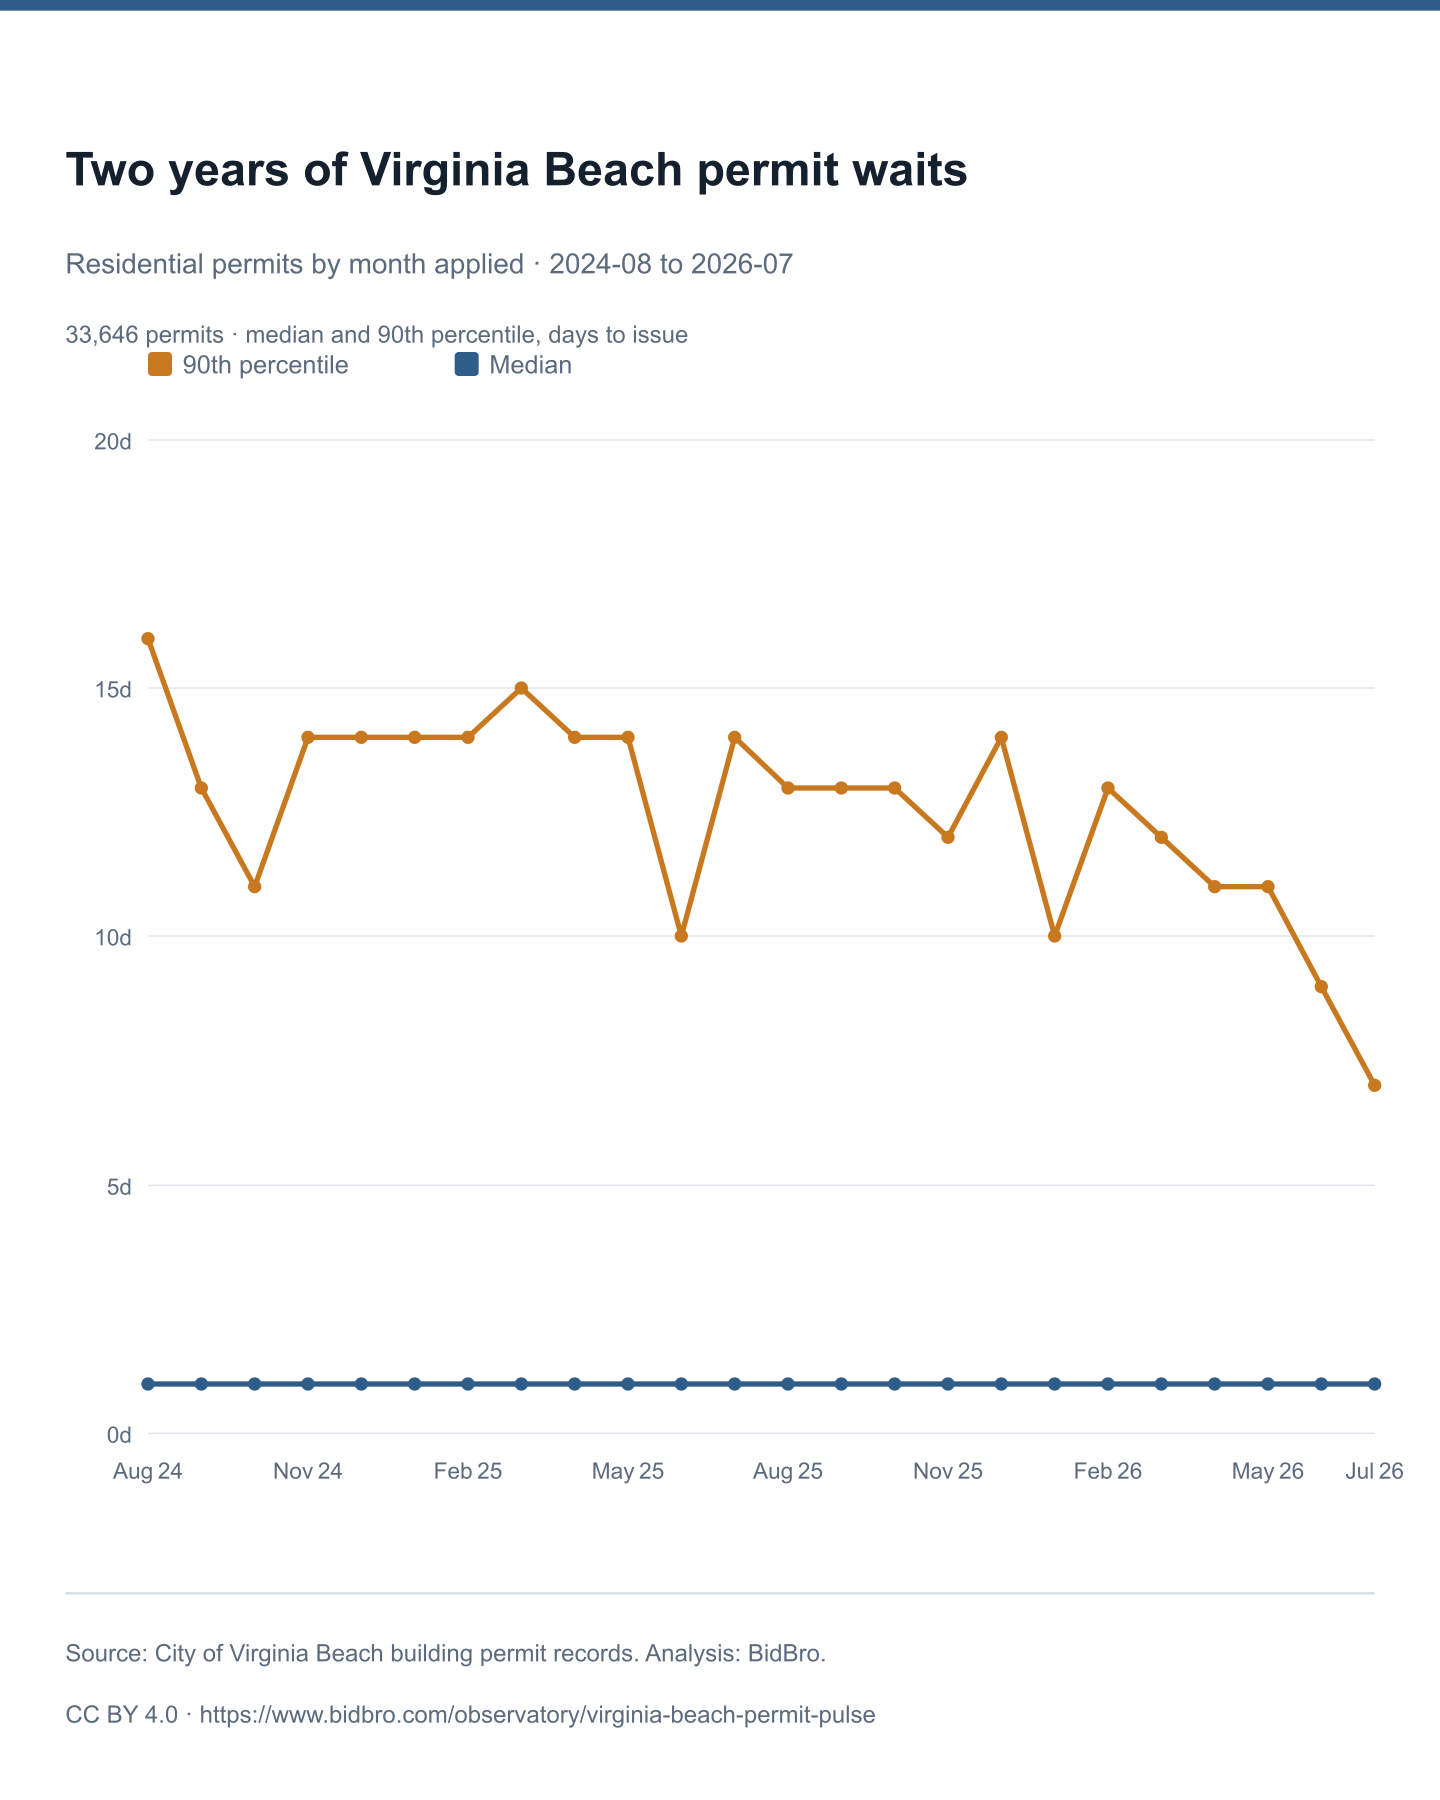
PNG (1080×1350, 108 kB)SVG (vector)
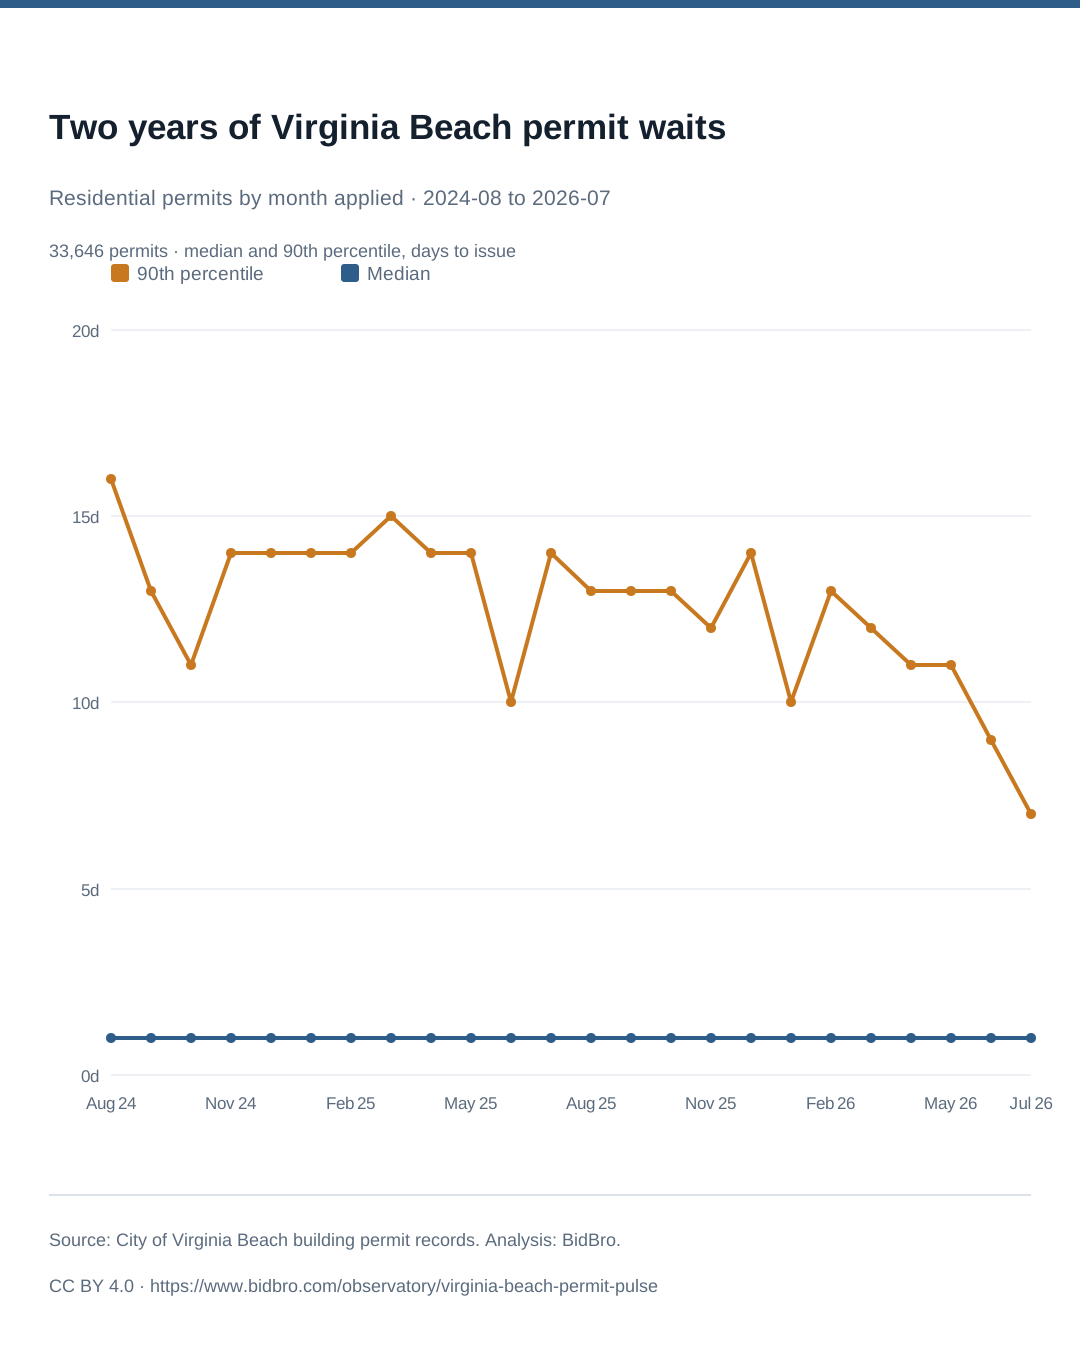
Text equivalent — the numbers in this chart
| Series | Median days | 90th percentile days | Still awaiting decision | Permits |
|---|---|---|---|---|
| 2024-10 | 1 | 11 | 0 | 1,404 |
| 2024-11 | 1 | 14 | 0 | 1,291 |
| 2024-12 | 1 | 14 | 0 | 1,139 |
| 2025-01 | 1 | 14 | 1 | 1,314 |
| 2025-02 | 1 | 14 | 0 | 1,148 |
| 2025-03 | 1 | 15 | 0 | 1,411 |
| 2025-04 | 1 | 14 | 0 | 1,601 |
| 2025-05 | 1 | 14 | 0 | 1,361 |
| 2025-06 | 1 | 10 | 0 | 1,324 |
| 2025-07 | 1 | 14 | 0 | 1,584 |
| 2025-08 | 1 | 13 | 0 | 1,540 |
| 2025-09 | 1 | 13 | 0 | 1,464 |
| 2025-10 | 1 | 13 | 1 | 1,542 |
| 2025-11 | 1 | 12 | 1 | 1,157 |
| 2025-12 | 1 | 14 | 0 | 1,249 |
| 2026-01 | 1 | 10 | 1 | 1,365 |
| 2026-02 | 1 | 13 | 0 | 1,326 |
| 2026-03 | 1 | 12 | 0 | 1,628 |
| 2026-04 | 1 | 11 | 0 | 1,688 |
| 2026-05 | 1 | 11 | 0 | 1,424 |
| 2026-06 | 1 | 9 | 0 | 1,652 |
| 2026-07 | 1 | 12 | 0 | 1,587 |
Embed code
<figure>
  <img src="https://www.bidbro.com/data/observatory/charts/permit-wait-24-months.png"
       alt="Line chart of Virginia Beach residential permit review times over 22 settled months, 2024-10 to 2026-07. The 90th percentile moves between 9 and 15 days; the median stays at 1 to 1 days throughout."
       width="1080" height="1350" style="max-width:100%;height:auto">
  <figcaption>
    Chart: BidBro. Source: City of Virginia Beach building permit records.
    <a href="https://www.bidbro.com/observatory/virginia-beach-permit-pulse">Virginia Beach Permit Pulse</a> · CC BY 4.0
  </figcaption>
</figure>
How these numbers were produced
- Source
- The City of Virginia Beach’s “Building Permits Applications” dataset, published by the City of Virginia Beach — Planning Department, Development Services Center through the city open data portal. The city also publishes its own building permit statistics. Extracted 2026-09-27.
- Unit of observation
- one building-permit application record published by the City of Virginia Beach.
- What is measured
- calendar days from the application date the city recorded to the issue date the city recorded. This is permit review time — not how long the construction work takes, and not the time from a homeowner’s first call to a finished project.
- Population and window
- The city’s dataset held 107,190 permit records at extraction, covering applications from 2023-01-01 to 2026-09-11. All of them were retrieved and counted; none were sampled. 104,888 had both an application date and an issue date and enter the statistics — 61,407 classed residential, 18,372 commercial.
- Exclusions, and how large each one is
- 2,302 records had no issue date and are excluded from every duration figure. Almost all are records the city leaves unclassified; only 6 of them are residential, so the effect on the residential figures is negligible.
- 0 records had an issue date before their application date and were dropped as data errors rather than counted as zero.
- 22,663 issued permits carry no construction class and appear in no residential or commercial total. They are not redistributed.
- Percentiles
- nearest-rank, not interpolated — every published percentile is a value some permit actually took. A permit issued the same day it was applied for counts as zero days, not one.
- Suppression floor
- Any cell computed from fewer than 30 permits is withheld and shown as “—”, with its permit count still visible so a reader can see what was suppressed and why.
- What is never published
- Street address, permit number, parcel identifier and applicant are never requested from the city’s API and never appear here or in the downloads. No BidBro bid record, contractor identity or homeowner information is used anywhere in this release — it is built exclusively from public city data.
- Reproducing this
- Every figure is a count, a median or a percentile over the city’s rows. Download the CSV or JSON above, or query the city’s service directly and repeat the arithmetic: filter to records with both dates present, subtract, and take the nearest-rank percentile.
Limitations
- This measures the city’s clock, not the applicant’s. A permit that was returned for corrections and resubmitted may appear as a new record; where it does, the wait a homeowner experienced is longer than any figure here.
- Permit review time is not project time. Nothing here describes how long work takes once a permit is in hand.
- Recent months read low until they settle. A permit enters these figures only once it is issued, so a month near the end of the city’s records holds its fast permits and not yet its slow ones. The “still awaiting decision” column does not capture this: the city’s feed carries almost no undecided residential applications, so that column reads near zero even for a month that is visibly incomplete. Since version 1.2.0 a month is therefore marked provisional until the records run 30 days past its end, and provisional months are left out of the monthly chart. Version 1.1.0 did not do this, and its August 2026 row understated the wait — see the version history.
- No causal claims. This release does not say why any figure is what it is, and does not attribute any change to city staffing, policy, or demand. That analysis requires review by people who work in this system, which has not happened yet.
- BidBro is an interested party. BidBro operates a contractor bidding platform in this market. That is why the method, the exclusions and the underlying file are all published: so the arithmetic can be checked by someone who does not take our word for it.
- The city’s data is the city’s. Its completeness and accuracy are outside BidBro’s control — see the city’s own statement below.
City of Virginia Beach data disclaimer
The data made available here has been modified for use from its original source, which is the City of Virginia Beach. Neither the City of Virginia Beach nor the Office of the Chief Information Officer (CIO) makes any claims as to the completeness, timeliness, accuracy or content of any data contained in this application; makes any representation of any kind, including, but not limited to, warranty of the accuracy or fitness for a particular use; nor are any such warranties to be implied or inferred with respect to the information or data furnished herein. The data is subject to change as modifications and updates are complete. It is understood that the information contained in the web feed is being used at one’s own risk.
License, citation and corrections
BidBro’s aggregate tables, the downloadable files and the interpretation on this page are published under Creative Commons Attribution 4.0. Republish them, including commercially, with attribution. The underlying records remain the City of Virginia Beach’s and stay subject to the city’s terms above. Reporters are welcome to use these tables directly; if a figure you need is not here, ask and we will say whether the data supports it.
Suggested citation
BidBro. “Virginia Beach Permit Pulse: how long a building permit takes.” Hampton Roads Home Project Observatory, version 1.2.0, 2026-09-27. Derived from City of Virginia Beach building permit records. https://www.bidbro.com/observatory/virginia-beach-permit-pulse
Corrections and data requests
Found an error in this arithmetic, or need a Hampton Roads construction figure for a story? Email ben.davis@bidbro.com — Ben Davis, Spokesperson, BidBro. BidBro publishes no phone number. Press questions we can support with defensible data get a human answer within one business day; where we cannot support a number, we say so rather than estimate. Full media kit: bidbro.com/press.
Version history
- 1.2.0 — 2026-09-27. Data refresh and a correction. Refresh: 107,190 city permit records extracted 2026-09-27 (from 105,454), covering applications 2023-01-01 to 2026-09-11 (from 2026-08-21) — the city’s feed held no later application on the extraction date; 104,888 issued permits in window (from 103,182). Published figures moved, for example residential Gas 90th percentile 9 → 8 days and Elevator 75th percentile 14 → 15. Correction: version 1.1.0 listed August 2026 as an ordinary month (834 permits, 75th percentile 2 days, 90th percentile 6) when the city’s records stopped on 21 August. The complete month reads 1,363 permits, 3 days and 8 days. That row was cut off, not fast, and it was not marked provisional because the only test for an unsettled month was a count of undecided applications that this feed barely publishes. Months are now provisional until the records run 30 days past their end, each with its reason, and the monthly chart plots settled months only.
- 1.1.0 — 2026-08-28. Data refresh against the city’s live feature service. 105,454 permit records (from 103,672), covering applications 2023-01-01 to 2026-08-21 (from 2023-01-01 to 2026-07-31); 103,182 issued permits in window (from 101,465). Published figures moved — every table, the CSV and the JSON are recomputed from the larger extract, so a figure cited from version 1.0.0 may differ here. Method, suppression floor and licence are unchanged.
- 1.0.0 — 2026-08-05. Distribution kit added: three charts in PNG and SVG, each with an accessible text equivalent, an embed snippet and
ImageObjectmetadata. No figure changed. The tables, the CSV and the JSON were byte-for-byte the release published on 2026-08-04; the charts are drawn from those same files, which is why the version number did not move. - 1.0.0 — 2026-08-04. First publication. 103,672 city permit records extracted 2026-08-04, covering applications 2023-01-01 to 2026-07-31. Tables by trade, construction class, year and month; CSV and JSON downloads.
Corrections are added here as dated entries. A number that changes is never quietly replaced.
Elsewhere on BidBro
- Virginia Beach contractors — contractors by trade across the city, with licence records where on file.
- Virginia Beach roofing contractors — the trade this release tracks as its own permit class.
- Virginia contractors — the statewide directory this market sits inside.
- Virginia home-improvement projects — live projects taking bids.
- Hampton Roads Home Project Observatory — the methodology and standing rules every release follows.